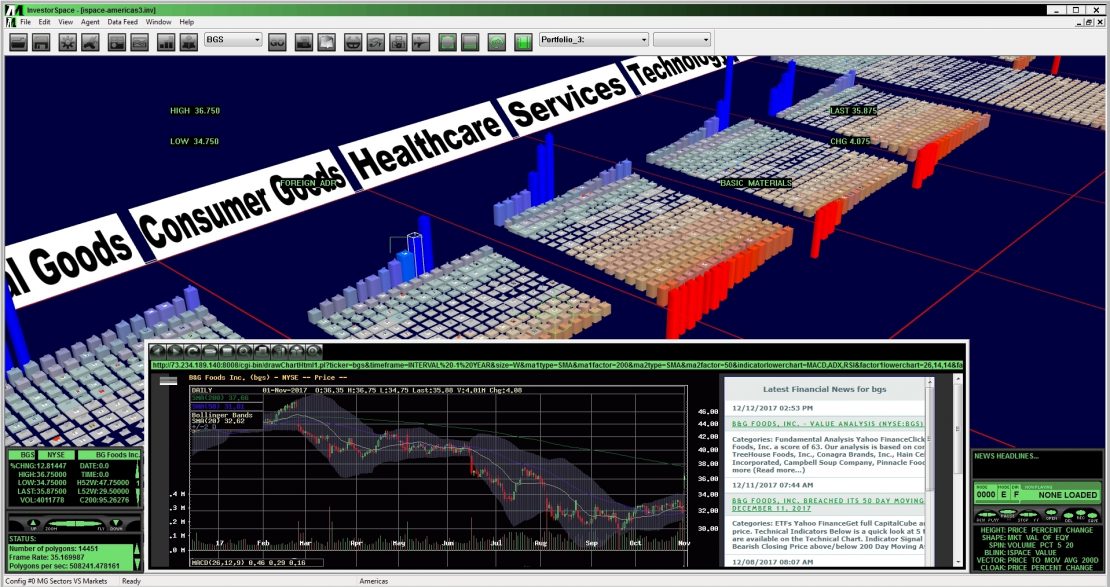
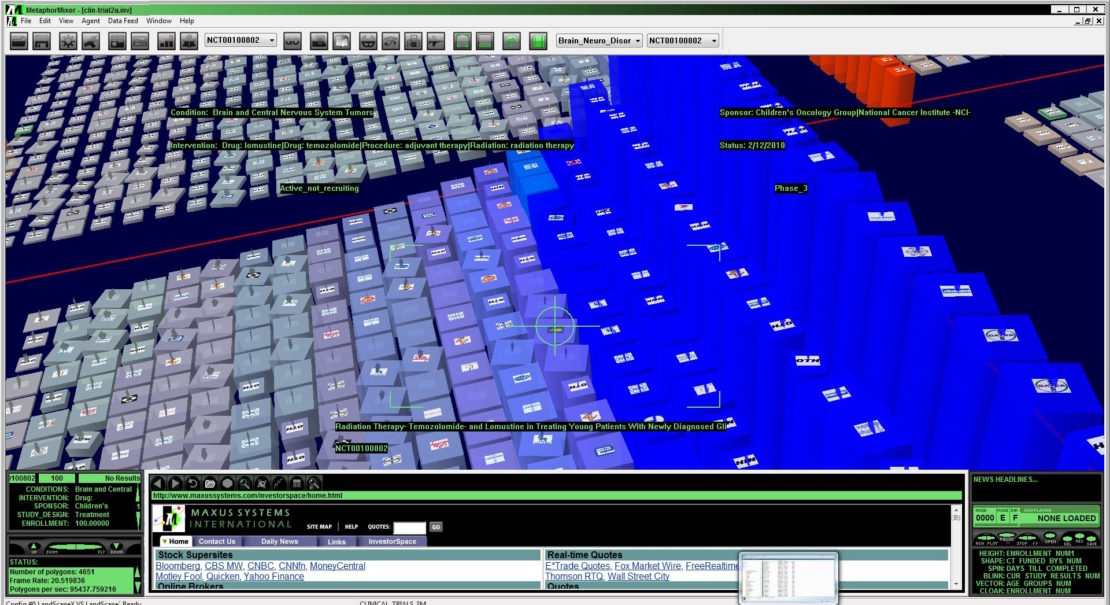
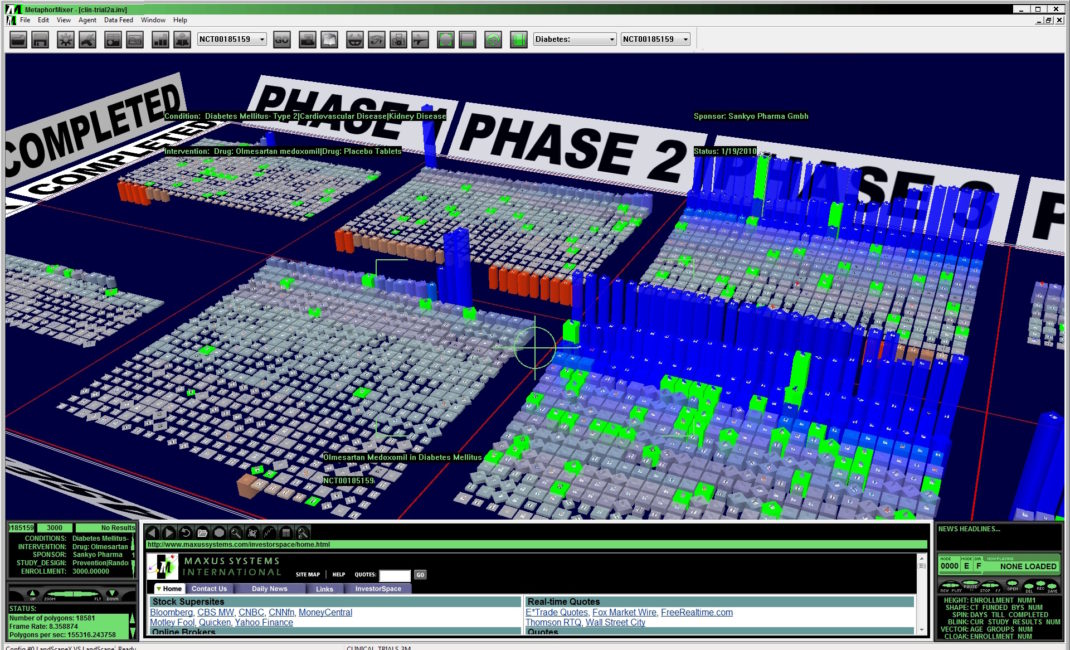
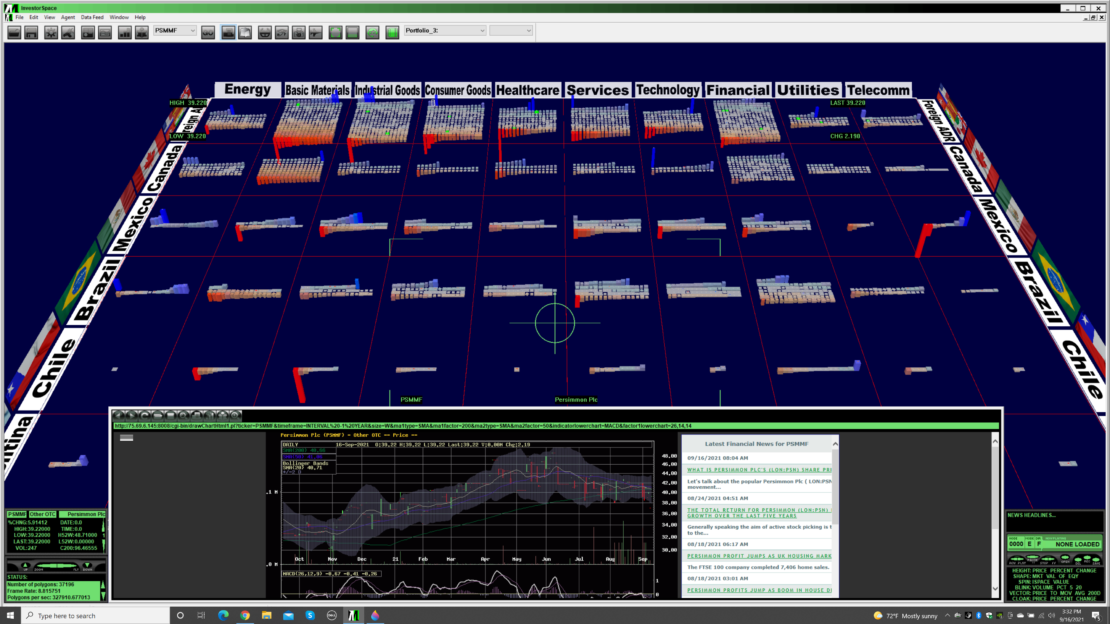
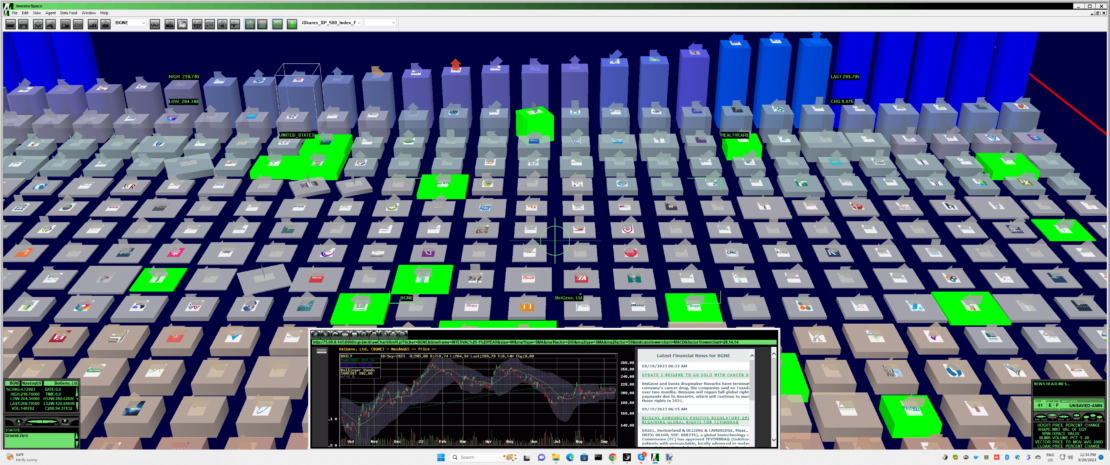
Metaphor Mixer® (MM) technology powers our suite of decision visualization software tools for the analysis of abstract data and information across multiple business domains. Each MM application receives, processes and displays real-time and database information from multiple sources in a 3-D environment called an Information Landscape.
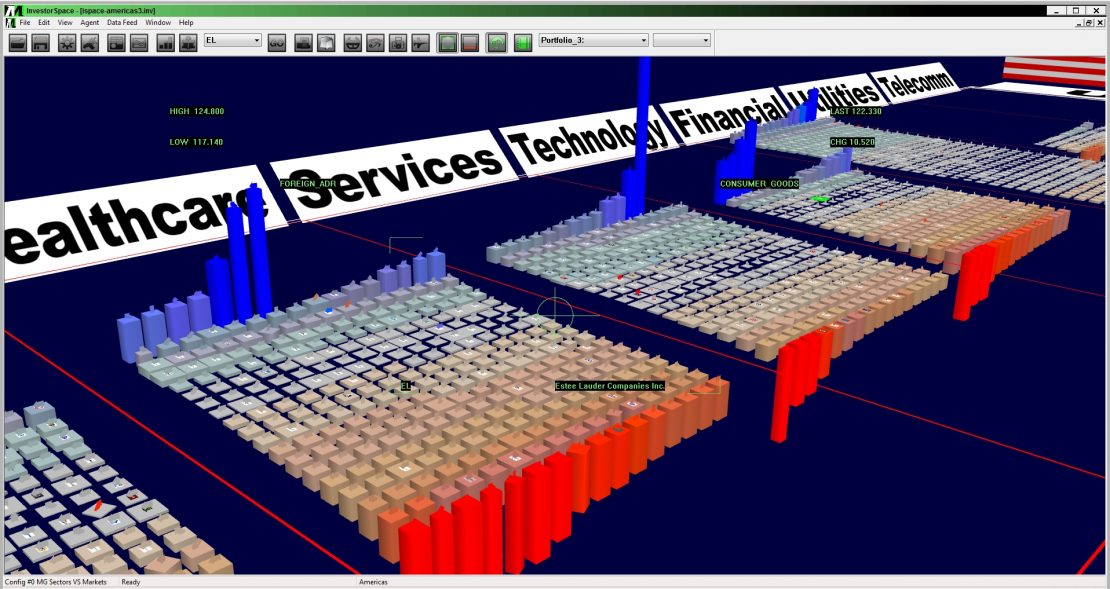
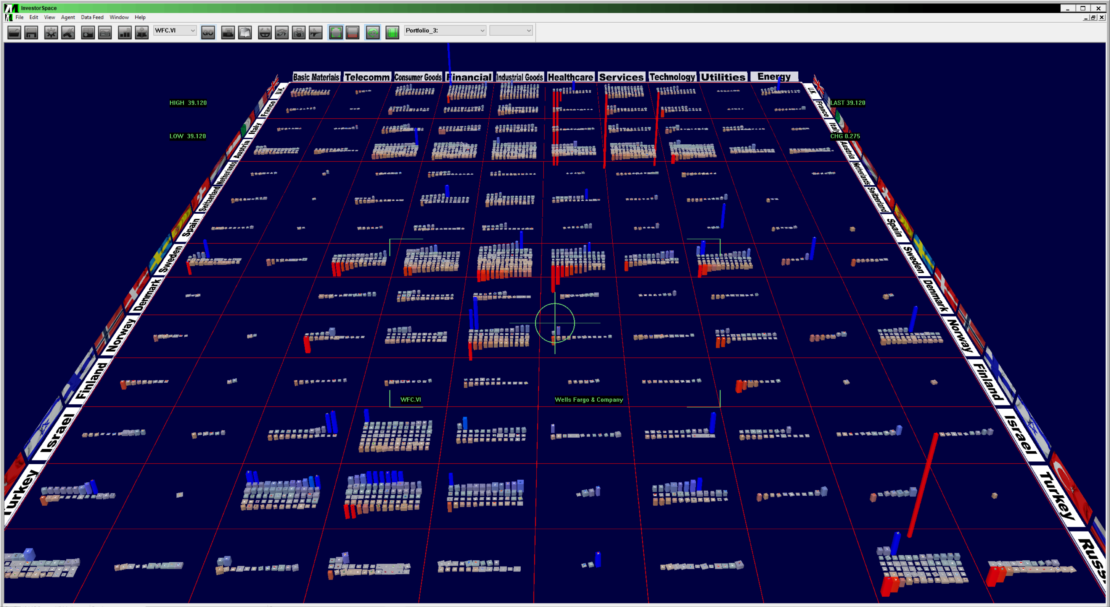
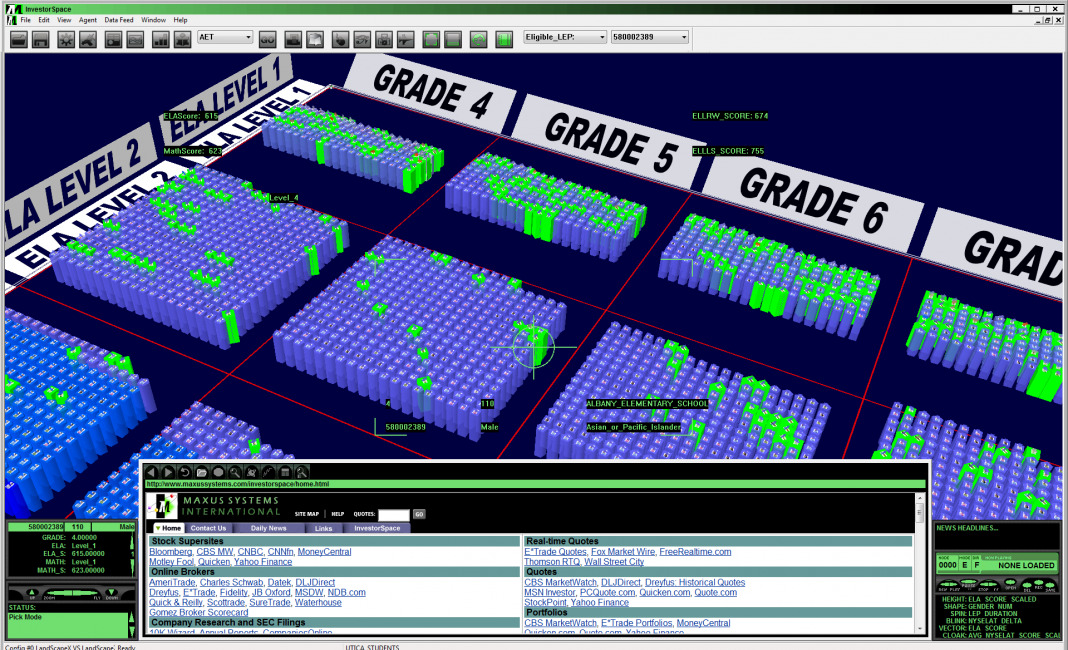
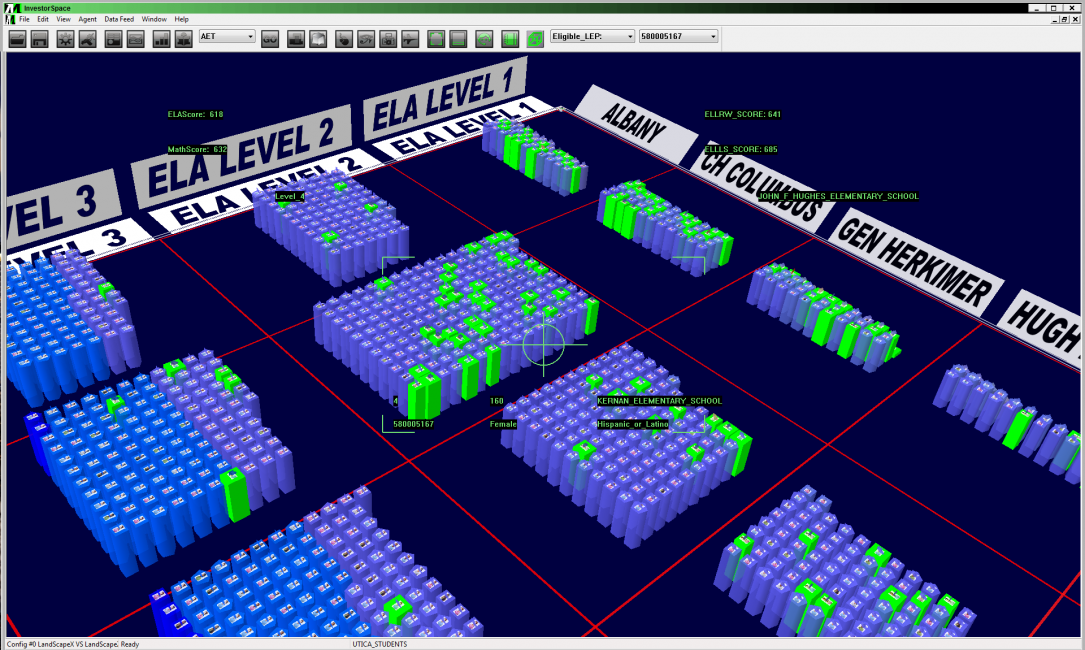
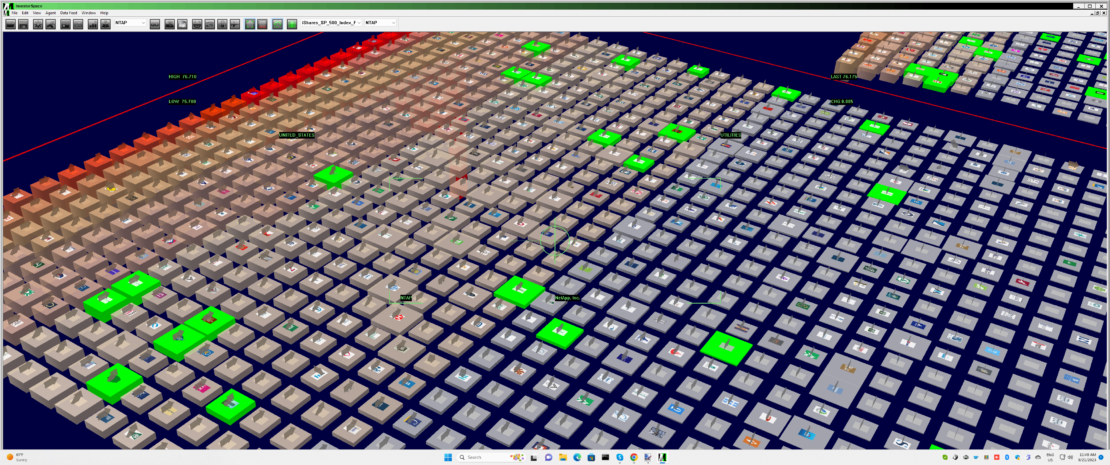
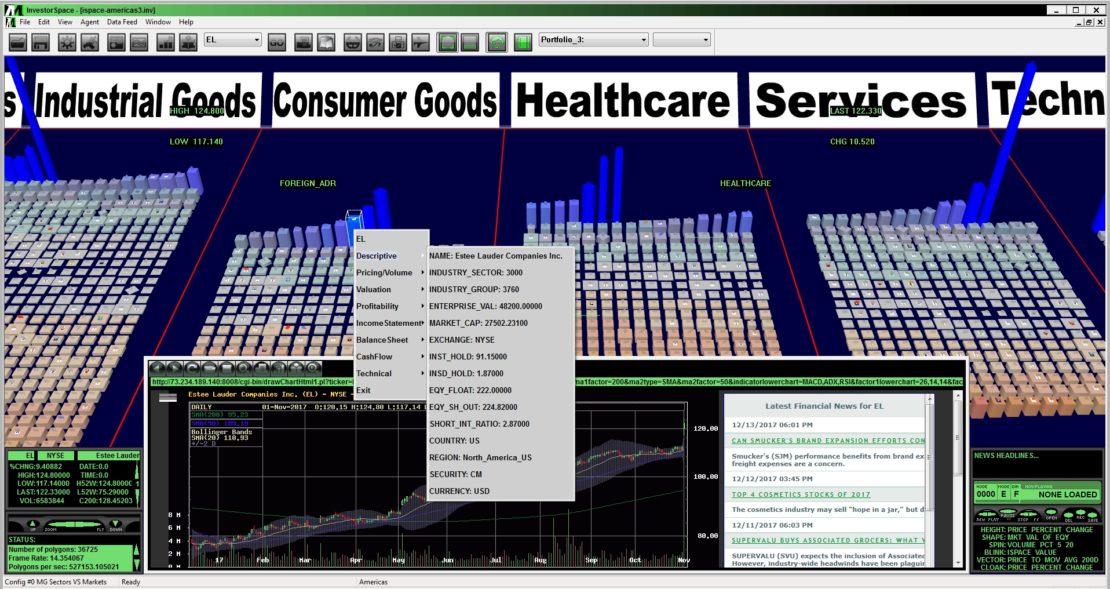
An Information Landscape consists of a categorically defined, 3-D planar surface intersecting a continuous numerical axis. Cells formed by the intersection of this matrix contain the individual data element icons comprising the user-specified categories. Users represent levels of hierarchical abstraction by defining subcategories of the Border Elements. For example, Countries are placed into Regions, Products into Categories, or Companies organized by Market Sector further subcategorized by Industry Groups. Any combination of these categories are then paired together to produce a corresponding Information Landscape. Users can configure an unlimited number of different Border Elements against each another within an Information Landscape.
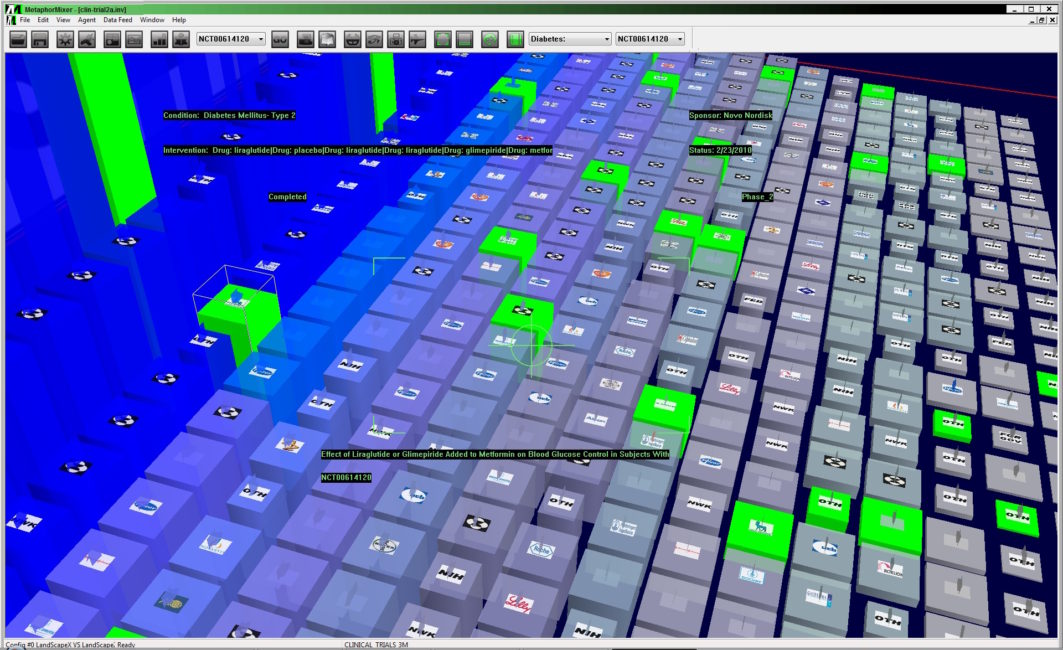
Individual data elements are represented as geometric objects, whose shape, color, behavior and relative position along the numeric axis reflect user-defined decision support criteria. The visual grammar of an Information Landscape is comprised of the following attributes:
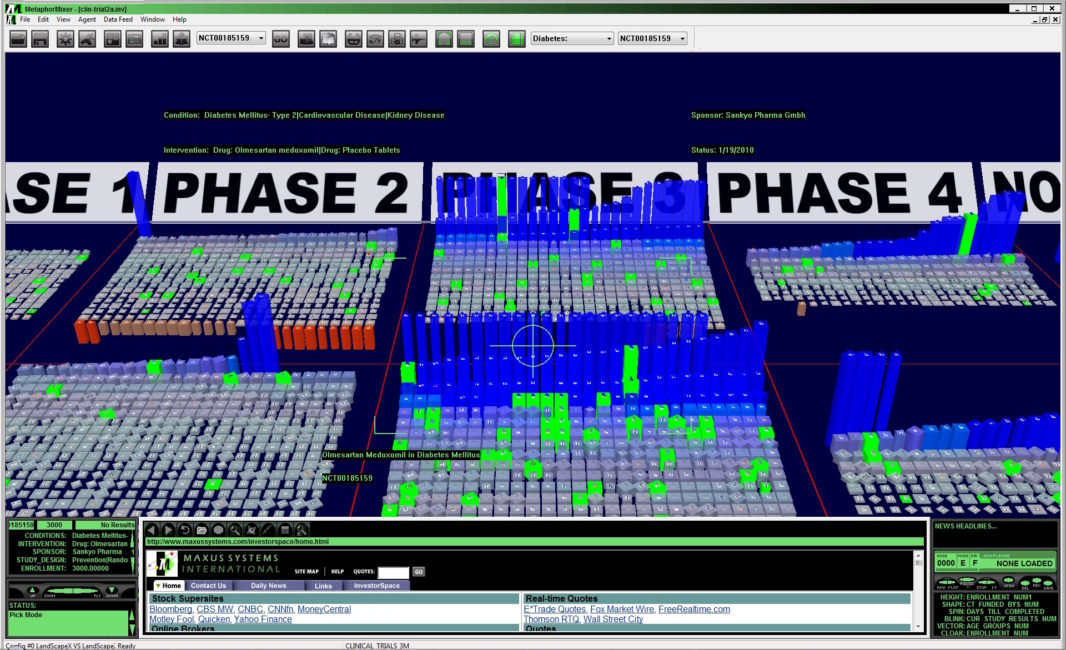
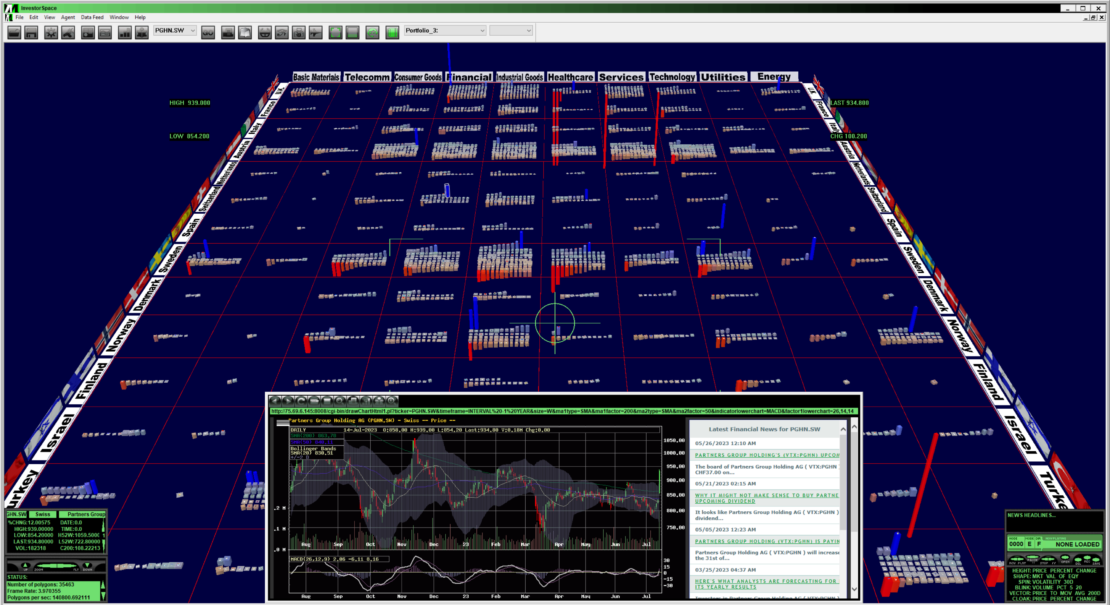
Border Elements: categories of information (i.e., Industry Groups, Geographic Regions, Market Segments, etc.) define an Information Landscape’s 2-D base.
Numeric Axis: a continuous axis that intersects the baseline of an Information Landscape to provide a third dimension (Height).
Color of Objects: typically blue to red, which visually reinforce Height along the numeric axis.
Shape/Size of Objects: triangles, squares and pentagons represent different types of data elements (i.e., small, medium and large cap stocks)
Images on Objects: corporate logos or other identifying symbols texture-mapped on the geometric objects.
Behaviors of Icons: spinning, blinking, quaking and sliding visual cues that highlight user-defined criteria.
Arrow Vectors: atop each object like the hour hand of a clock, reflect changing conditions and values of data elements.
Intelligent Agents: interactive ChatGPT-enabled assistants perform user-defined information gathering tasks.
Speech Recognition and Video Conferencing: allow users to communicate with the agents and with other users, for collaborative applications.
The Metaphor Mixer® Data API supports numerous plugins for direct financial data feeds such as Bloomberg and Reuters as well as SQL and NOSQL databases through JSON.
The Metaphor Mixer® Data APIs are scalable and designed to seamlessly integrate with existing multidimensional modeling and on-line analytic processing tools.
The software is based on industry standard databases and database connectivity drivers for maximum compatibility with both in-house legacy systems as well as newer corporate enterprise-wide systems like SAP BIW and SAP HANA.
Together, the suite enables powerful decision support visualization applications designed specifically to address the complex analyses required to mine the largest databases and affords the decision maker the topsight needed to observe, orient, decide and act more efficiently, and with greater knowledge, than the competition.
 MAXUS SYSTEMS INTERNATIONAL