 MAXUS SYSTEMS INTERNATIONAL
Home / Case Studies
Case Studies
Data Mining Solutions: Methods and Tools For Solving Real World Problems
by Christopher Westphal & Teresa Blaxton, John Wiley and Sons Inc.
Case Studies:
1. Managing Investments in an Unstable Asian Banking Market
2. Managing Declines in the Technical Sector
3. Discovery of Insider Trading Patterns
Wall Street and other financial markets are increasingly turning to the use of visual data mining techniques to deal with large quantities of data. This chapter introduced a set of data mining applications in which Metaphor Mixer (MM) was used to discover and analyze some very complicated patterns of data within the Asian financial markets. One of the MM applications was used to identify a significant downward trend in the Japanese banking system by taking advantage of financial indicators that were modeled at the time. By visually presenting all of the variables within the market, the institution was able to discover this trend early and respond by moving some of their risky investments into more secure and convertible instruments. Thus the fund was well prepared when the collapse occurred. The other application was helpful in revealing a pattern of insider trading by a Japanese firm. Managers of the fund were able to take advantage of the situation legally by adjusting their own acquisitions so as to maximize profits as stock prices were instrumental in this situation because it not only helped the fund managers to discover the pattern but was also used to justify buying and selling behaviors to the SEC when they investigated the matter several years later.
Managing Investments in an Unstable Asian Banking Market
The data mining activity described here occurred between January and April of 1992 and involved investments made by the institution within the Asian markets for a particular actively managed index fund. For those who may remember, banks in Japan and other Asian countries became unstable and inherently volatile during that period. The prices associated with many of their stocks tumbled, producing record losses across the board. Even though the markets for all industries took a big drop, the banking industry was hardest hit. This narrative describes what happened with the Japanese banks, how this investment firm identified the weakness, and what they did to turn it into an opportunity to make record profits.
METAPHOR MIXER (MM) was chosen for this application because its information terrain paradigm was an ideal representation for helping to manage the analysis of large quantities of complex financial data. The border elements (e.g., grid axes) defined within the application were configured to represent different target analysis groups. Along one dimension were the industry segments such as electronics, financial, construction, manufacturing, utilities, automotive, paper, and so on. On the other dimension were Asian financial markets including Japan, Thailand, Singapore, Malaysia, Indonesia, and Hong Kong. (Figure 1 shows the border elements defined for this application.) Multiple levels of abstraction could also be presented within the border elements by adjusting the breakdowns represented (e.g., various types of consumer electrical equipment, certain categories of automotive manufacturing, or even the orientation of the different financial investments used by the banks).
Additional levels of abstraction could also be presented within the border elements by adjusting the breakdowns represented (e.g. various types of consumer electrical equipment, certain categories of automotive manufacturing, or even the orientation of the different financial investments used by the banks). Within each cell of the matrix produced by the border elements selected by the portfolio manager were objects that represented the individual stocks being traded within their respective markets. The objects could be manipulated on several dimensions including color, shape, and presentation style (e.g. blinking and spinning) to convey further information about performance, behavior and future projections.
Figure 1 shows the border elements defined for this application.
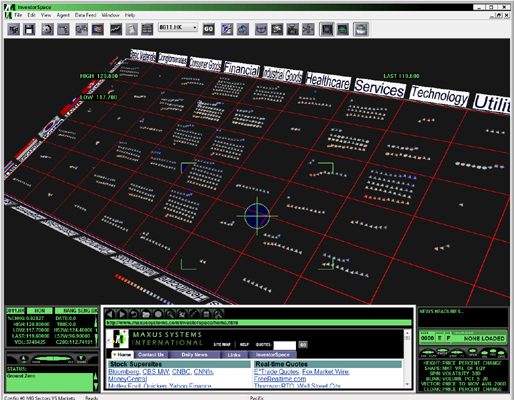
Figure 1
The information terrain within this application depicted the stock data using a variety of display dimensions. The color of a particular stock in the display conveyed information about how well it was performing with respect to its market index. A red chip indicated that the stock was down in value from a previous posting (e.g., usually tied to a daily value) whereas a blue chip showed a positive value. The color gray signified no substantial change in price. The baseline of the MM display was set to the index of the market being analyzed. The height of the chips within the terrain showed how far above or below the index the particular stock was performing.
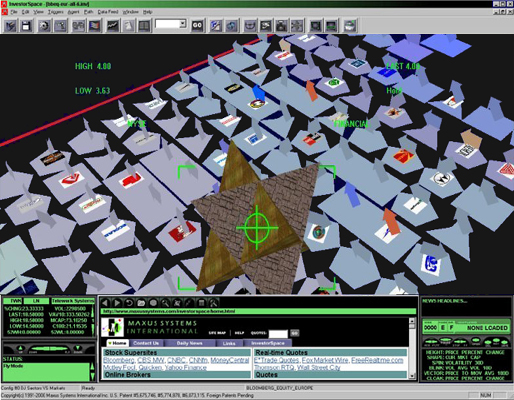
Figure 2
If that same data element had an arrow vector pointing out, it would also indicate the stock had some sort of low technical indicator, such as a moving average. This provided a third decision element that reinforced the portfolio manager’s judgment to buy a stock or look more closely at it because three very important outlier statistics had been flagged on that security element. (Figure 2 presents an example of a MM display showing the different display characteristics for this type of information.) A spinning chip indicated that a stock had attractive characteristics such as a low price-to-earnings ratio with high earnings potential (referred to as a low p/e growth rate). Blinking was tied to certain arbitrage possibilities as determined by the stock’s options or warrants.
Within this MM application, the portfolio manager was able to incorporate as much knowledge as possible from the available information and make more informed and timely decisions. He was able to isolate anomalies and potential opportunities using a topsight display that allowed him to drill-down and focus on specific market indicators. This guided further investigation of various options and investment strategies. The portfolio manager also used the MM system to key in on estimates made by various brokers who were analyzing the companies in the index. At the same time, MM was fusing background information, real time data, and consensus estimates from brokers regarding projected earnings. Live news feeds could be scanned to look for keywords indicating earnings surprises or shortfalls. As these were identified off the news service, the MM agent would pop up and drag the portfolio manager’s viewpoint to that element and display the headline to the news wire story. This arrangement resulted in a decision space that integrated historical, current, and future estimates data into one model that supported situational awareness of the market at any given time. At this point, the institution had an operational visualization environment that allowed its portfolio managers to do screen searches and sorts on all of these integrated variables.
Because of their use of this MM application, the institution was one of the first firms participating in the Asian markets to identify the initial slide in 1992, identifying the price change collapse as well as other fundamental and technical analysis elements. One trend that was spotted early on involved equities and convertible bonds issued by the Bank of Tokyo. Depending on price, investors may want to trade convertible bonds like equities. A convertible bond with an “exercise price” far higher than the market price of a stock generally trades at its bond value, although the yield is usually a little higher due to its lower credit status. However, when the bond’s share price is sufficiently high, traders want to use the convertible more like an equity. If the exercise price is much lower than the market price of the common shares, the holder of the convertible bonds can convert into the stock attractively. Issuers sell convertible bonds to provide a higher current yield to investors and equity capital upon conversion. Investors buy convertible bonds to gain a higher current yield and less downside, since the convertible should trade to its bond value in the case of a steep drop in the common share price.
What happened in this case was that the investment firm saw that the equities issued by the Bank of Tokyo were decaying at the same time that convertible bond arbitrage opportunities were being made available. This was conveyed in the MM application by coding colors, heights, spins, and blinks to fuse the convertible bond information with that of the underlying bank’s stocks. Analysts were able to see that market volatility was increasing by changes in the spinning and the blinking in the displays. However, there were also indicators showing that a convertible bond issue that was available that could be swapped out for the stock.These behaviors were being displayed in real time in the application and when the big crash came and everything went red in MM (e.g., all the chips dropped below the baseline- see Figure 3), the firm had already safely ensconced most of their capital in convertible bonds.
This was an important move because of the way the firm evaluated the performance of its investments. Specifically, the Japanese bank markets formed a major portion of the index against which performance was assessed. Thus, the firm wanted to participate in the banking industry because it comprised such a large portion of the index, and buying into the convertible bonds allowed them to be in the banking market without realizing losses when the stock prices dropped. In addition, the investment in the Bank of Tokyo’s convertible bonds and others like it allowed the fund to maintain its currency in yen mandated for the portfolio’s diversification requirements. By being alert to the growing sector instabilities and anticipating a sudden volatility spike, the portfolio manager took advantage of the situation. Below we will explain in detail how he was to surf the downside curvature of a convertible bond.
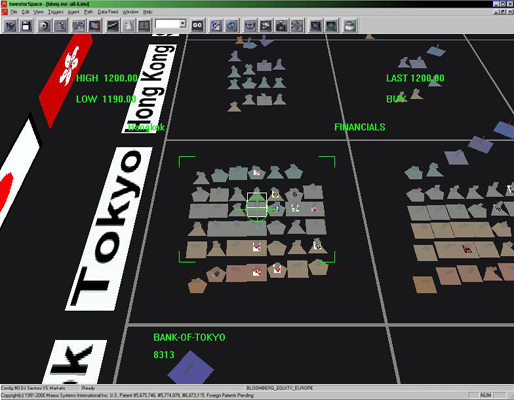
Figure 3
When the market crashed, the convertible bonds did not go down. Instead, they actually went up in price. This occurred because in the panic sell-off of the market, the Japanese government was forced to lower its interest rates. As with all markets, bonds are inversely proportional to the interest rates. So when the rates are lowered, bond prices increase. On average, the Japanese stocks dropped over 15 percent in value while the convertible bonds increased 10 percent in the same time interval. This meant that the pension fund outperformed the market by 2500 basis points. (To say that this was a good outcome is a gross understatement.) Thus, it was an intelligent move in terms of identifying a weakness and finding the attractive alternative possibilities. This investment tactic would likely not have been pursued without the use of MM. That is, the firm used MM to fuse the real-time data with arbitrage information and the historical earnings estimated into one display state in addition to sorting by industry groups and countries. This allowed them to see early on that the weakest part of the industry was the Japanese banking sector. Thus on April 8, 1992, when the market took its hit, the portfolio managers were sitting pretty because they had already been able to predict the collapse and redirect some of their Asian banking investments into convertible bonds. This resulted in an initial gain of approximately $10 million dollars. Had they not taken this action they might have lost between $30 and $40 million, so the “real” net gain approached $40-$50 million dollars. The institution has maintained their investment in convertible bonds, and over the past several years the Japanese banks have still continued to decay. However the fact that much of the investments were swapped into convertible bonds early meant that they never lost ground. The investments were always in the index with the stock, and they were earning a rate of return from convertible bond interest instead of getting nothing from equities.
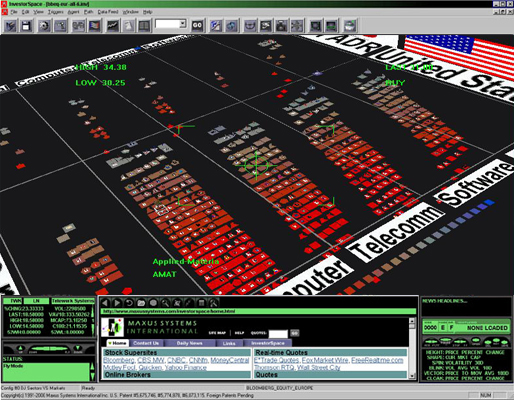
Figure 4
Managing Declines in the Technical Sector
A crisis similar to the Japanese banking crash occurred in he summer of 1996 in the technology sector. The crisis was identified in MM using similar information fusion technologies as those employed in the Asian market application. In this case the recovery of the market was also tracked. Red icons in the MM landscape grid depicted drops in stock prices below the baseline. Quaking in the icons depicted further day-to-day drops and spinning icons showed low price-to-book ratios. Blinking was keyed to high returns on equity. Figures 4 & 5 show sample MM displays depicting the U.S. technology market information.
During the period initially following the crash, all of the stocks were below baseline and were, not surprisingly, oversold. The challenge was to determine whether anything might be salvaged from the situation. Although the stocks in question were shown to be below baseline in the MM application, analysts were able to determine that some of these stocks might be good investments because some of their fundamental indicators (shown as arrows on the icons) started to show upward trends. That is, the analysts were able to determine that even though the technology sector had bottomed out, certain stocks showed behaviors that made them less risky for investment at that time.
The type of data visualization provided by MM helped the financial managers to determine which of the hundreds of stocks merited further attention, even within a market that had recently crashed. Note that there was no magical black box that told analysts when to but, but the use of visualization allowed knowledgeable analysts to make the most out of information at hand. The information maintained in the MM terrain during the technology crash episode can be replayed using the MM’s VCR feature. Analysts in the company can replay a movie that includes data collected over 3-4 months before, during and after the crash. The VCR replay shows when stock prices bottomed out, identifies which interests and industry groups were most severely affected, and shows the return of certain key stocks within the overall population.
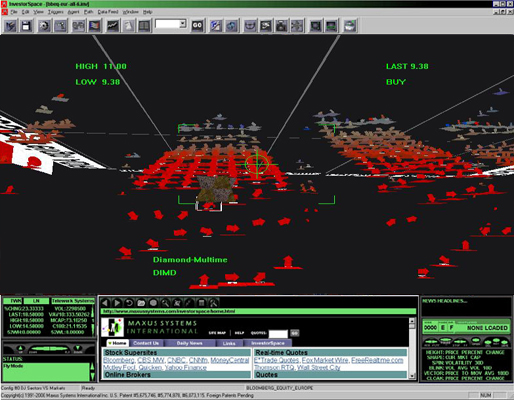
Figure 5
Discovery of Insider Trading Pattern
Using what would eventually become the MM inference engine, the investment firm developed an application that displayed the activity profiles of a set of stocks that were members of an Asian index. In this application the analysts were particularly interested in monitoring patterns of trading volumes of a set of Japanese stocks. One of the most salient stocks identified by the institution was a large Japanese-based corporation that was cyclically manipulated in an insider trading scam by a group of Japanese investors. Regular patterns of volume spikes were discovered in the trading data for this stock. The patterns began with an initial day of elevated trading that would move a set of stocks up 5-10 percent in value (See Figure 6). The elevated trading would last up to five days. This initial period was then followed three to six months later by a precipitous drop in prices. The pattern occurred with remarkable regularity and, as it turned out, signaled the operation of an insider trading scam.
Since any of the stocks being manipulated were typically poor performers, they were likely to be underweighted within the portfolios maintained by investment managers. The frenzy of buying by the insider traders significantly inflated the price of the stock, thereby casing a big delta in the index ratios expected for the portfolio. Large portfolio managers then purchased the stock, the insider traders sold at the higher price, and the portfolio managers took a loss as the price eventually fell back to its true price range.
Once the pattern of insider trading was discovered using MM, the portfolio manager at the investment firm was able to avoid losses on this stock. The manager purchased only enough stock to achieve market weight, so that the investment could track with the index.However, the manger did not over purchase the stock, thus setting himself up for a loss.
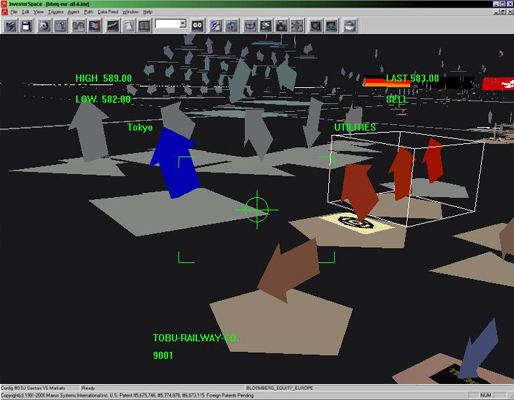
Figure 6
That is, since the manager knew that the price was going to fall, he arranged his investments so as to shield against any index fluctuations while selling out of the stock as it hit its highest levels. Thus, by discovering this pattern of insider trading, our investment company was able to beat the insider traders at their own game using legal means, thus saving their clients millions of dollars. As it turned out, the insider traders became aware of the actions of the investment firm, and believed that a pension fund manager must have been receiving leaks of inside information from someone involved in the scam. Nevertheless, they were hardly in a position to do anything about it since any complaint would have drawn attention to their own illegal activities. (Little did they know that it was sophisticated data mining analysis, rather than information leaks, that had given them away.
Excerpts from
Data Mining Solutions: Methods and Tools For Solving Real World Problems by Christopher Westphal & Teresa Blaxton, John Wiley and Sons Inc.